
TRCC News
Thai–Slovak Business Forum: Trade Patterns Ahead of Bangkok Talks
Ahead of the Thai–Slovak Business Forum on 12 October, TRCC examines five years of bilateral merchandise trade, comparable January–July figures for 2026 and the leading product groups.
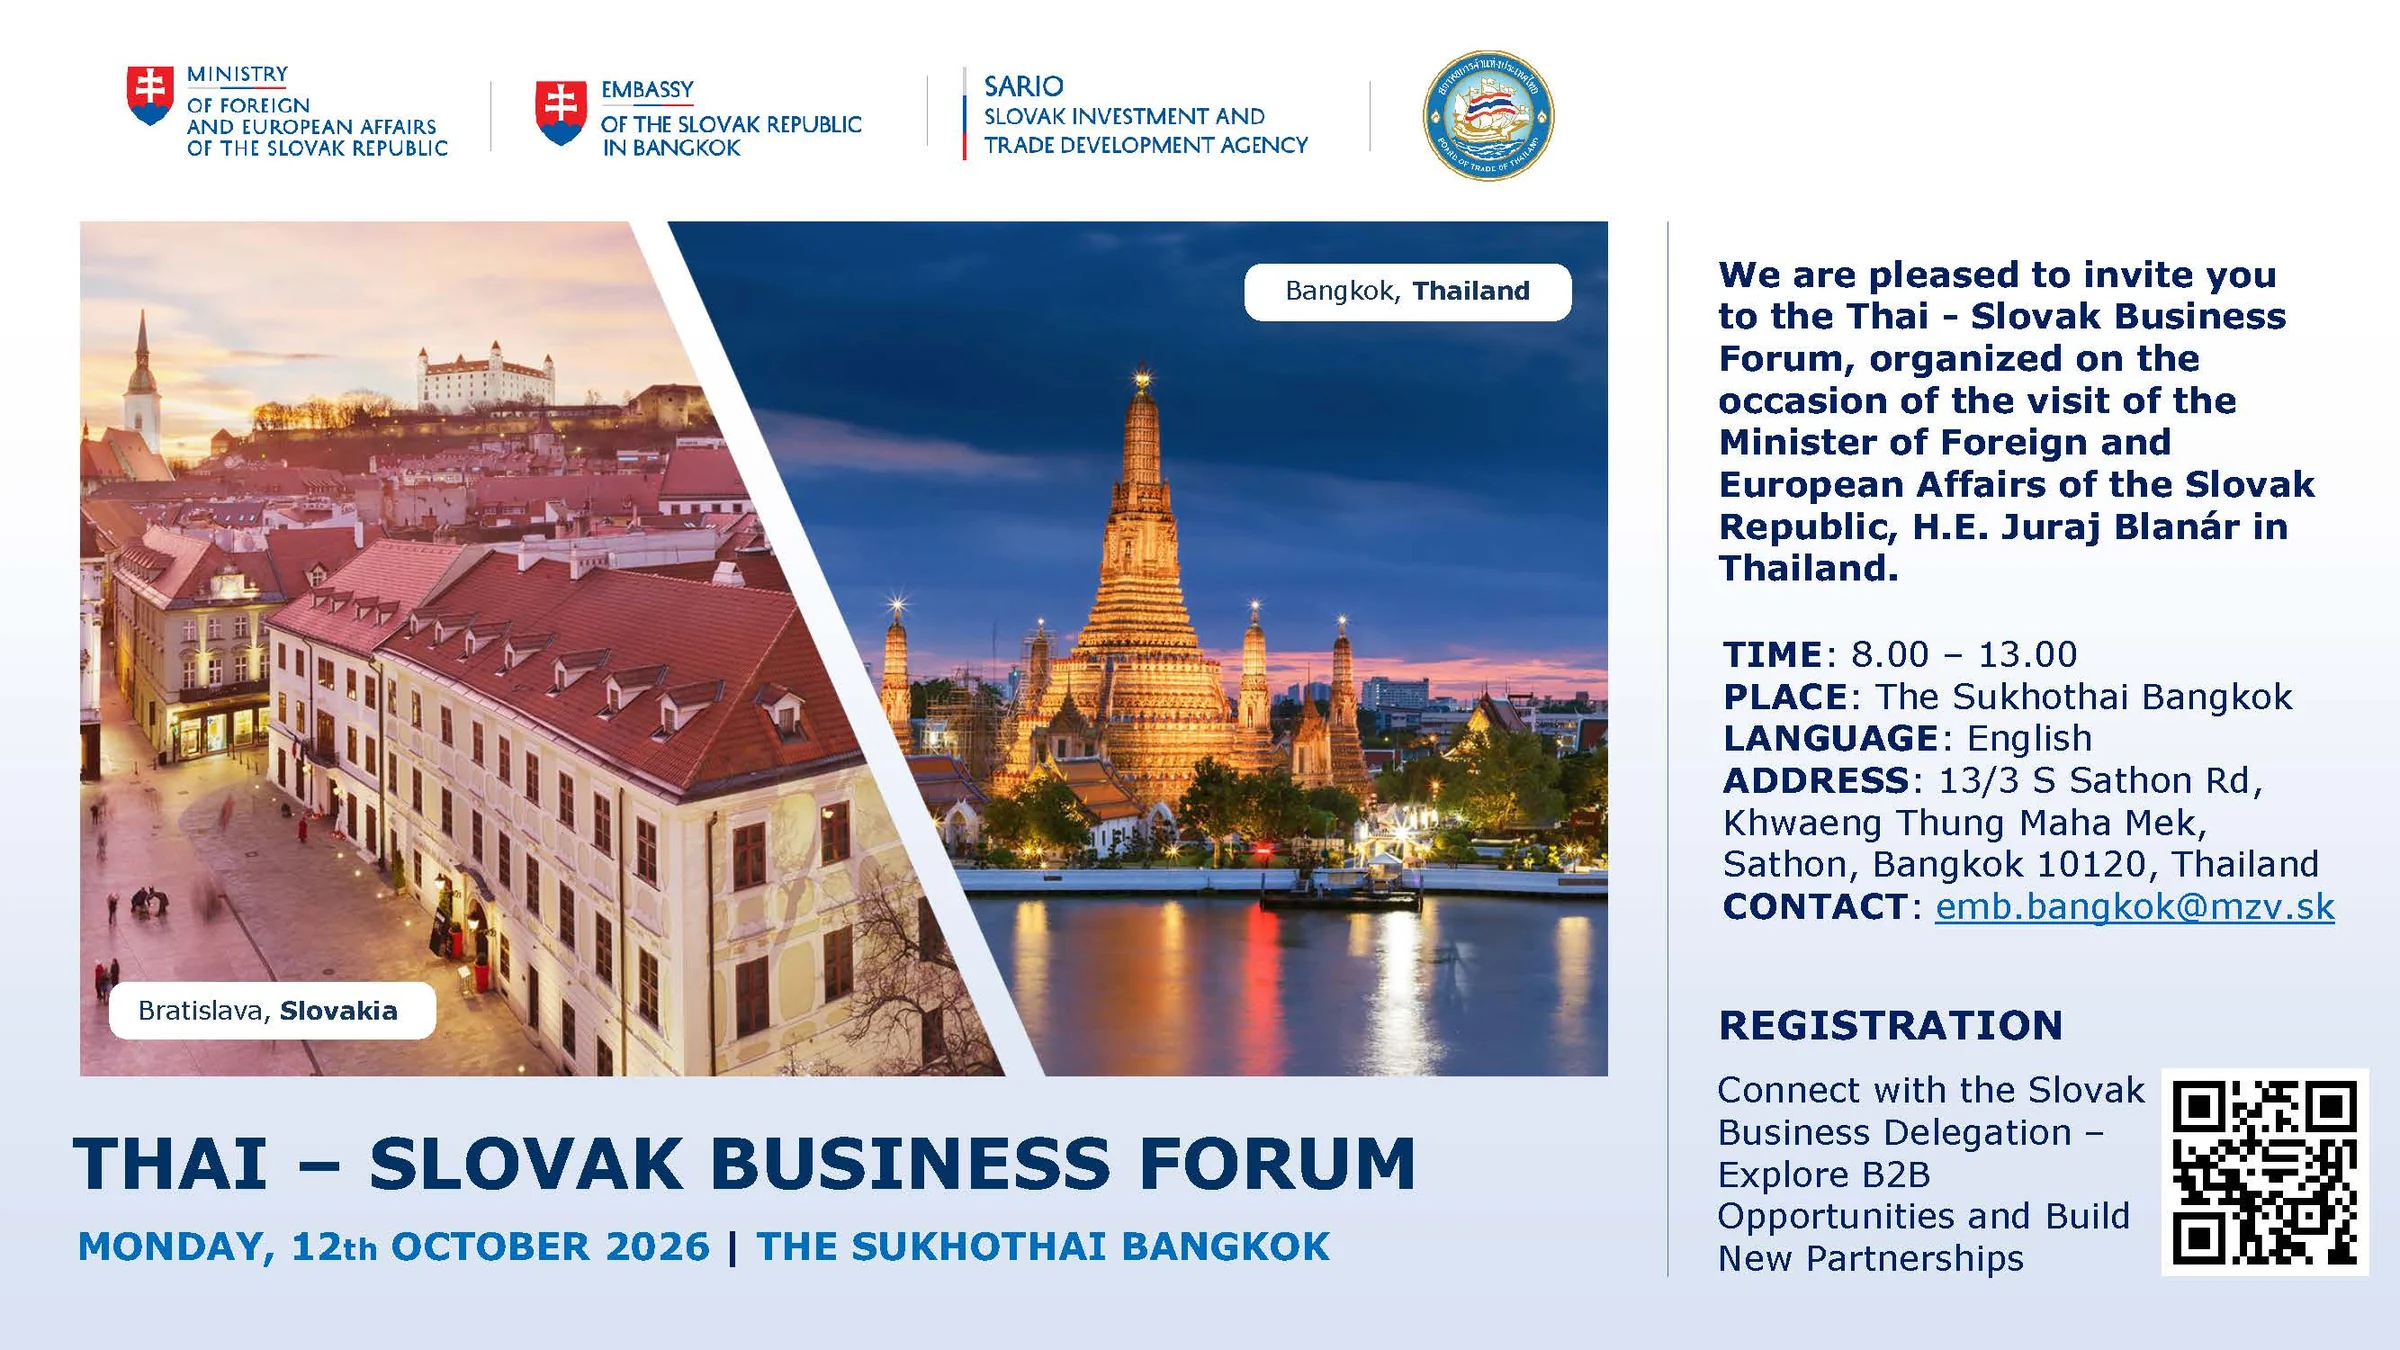
The forum forms part of the wider Slovak business mission to Thailand on 10–12 October. To put those conversations in context, TRCC has reviewed its published Ministry of Commerce statistics. All figures below describe merchandise trade from Thailand’s perspective and are expressed in US dollars.
Three takeaways for business
Recovery is not a steady trend. In 2025, Thailand’s merchandise exports to Slovakia rose while its imports from Slovakia fell. Total bilateral merchandise trade recovered but remained below its 2023 level; a business plan should not assume uninterrupted growth.Both directions grew in January–July 2026. Thailand’s merchandise trade with Slovakia totalled USD 222.14 million, up 24.4% compared with January–July 2025, with both exports to Slovakia and imports from Slovakia increasing. This supports discussing opportunities on both sides of the trading relationship, but it does not establish demand for an individual product or predict the full-year result.
Product detail matters. Electrical and electronic equipment (HS85) accounted for 66.6% of Thailand’s merchandise exports to Slovakia in January–July 2026, while Thailand’s imports from Slovakia were spread more widely across the leading chapters. Use the product links below to identify the relevant category before assessing a potential partnership.
Five years of trade: recovery, but not uninterrupted growth
TRCC’s annual trade history for 2021–2025 shows considerable variation. Reported bilateral trade increased from USD 275.66 million in 2021 to USD 356.57 million in 2023, fell to USD 286.49 million in 2024 and recovered to USD 343.74 million in 2025. The 2025 result was a recovery, not a new five-year high.Thailand’s exports to Slovakia reached USD 267.33 million in 2025, up 42.6% from 2024. Imports from Slovakia fell by 22.9% to USD 76.41 million. Thailand recorded a merchandise trade surplus in every year shown, reaching USD 190.92 million in 2025.
Thailand–Slovakia merchandise trade, 2021–2025
2021 – 2025 · USD · Thailand reporting
Thailand exports to SLOVAKIA
Thailand imports from SLOVAKIA
USD · M = million · B = billion · K = thousand
Exact annual values and changes · USD
| Period | Thailand exports to SLOVAKIA | Thailand imports from SLOVAKIA | MOC-reported total trade | Thailand balance |
|---|---|---|---|---|
| 2021 | 151,093,476.9587 | 124,568,446.9267 | 275,661,923.8854 | 26,525,030.032 |
| 2022 | 200,111,553.6705+32.4% | 92,075,518.8969−26.1% | 292,187,072.5674+6.0% | 108,036,034.7736+81,511,004.74 USD |
| 2023 | 212,755,584.2071+6.3% | 143,810,278.1911+56.2% | 356,565,862.3982+22.0% | 68,945,306.016-39,090,728.76 USD |
| 2024 | 187,407,886.6142−11.9% | 99,086,020.121−31.1% | 286,493,906.7352−19.7% | 88,321,866.4932+19,376,560.48 USD |
| 2025 | 267,333,017.0985+42.6% | 76,409,726.9061−22.9% | 343,742,744.0046+20.0% | 190,923,290.1924+102,601,423.70 USD |
Source: Information and Communication Technology Center with cooperation of the Customs Department (MOC Thailand Trade Report). TRCC statistics for this selection.
Merchandise trade only. Exports include re-exports. Prepared values stay fixed; provisional source data may later be revised.
Method and data notes
Exports include re-exports. Prepared values stay fixed; provisional source data may later be revised.
Changes compare consecutive calendar years or the same YTD cutoff. Balance changes are absolute currency amounts. No comparison is shown without a selected comparable baseline.
January–July 2026: both trade directions increased
The comparable January–July statistics for 2025 and 2026 show a different pattern: both exports and imports increased against the same seven months of the preceding year.Thailand exported USD 169.28 million to Slovakia, up 24.5%, and imported USD 52.86 million from Slovakia, up 24.3%. MOC reported bilateral trade of USD 222.14 million, an increase of 24.4%, and a surplus for Thailand of USD 116.41 million. These comparisons use January–July in both years; they do not forecast the eventual 2026 result.
Thailand–Slovakia trade: January–July comparison
January–July 2025 – January–July 2026 · USD · Thailand reporting
USD millions · same scale, starting at zero
Thailand exports to SLOVAKIA
2025136.02 million
2026169.28 million
Thailand imports from SLOVAKIA
202542.54 million
202652.86 million
Exact YTD values and changes · USD
| Period | Thailand exports to SLOVAKIA | Thailand imports from SLOVAKIA | MOC-reported total trade | Thailand balance |
|---|---|---|---|---|
| January–July 2025 | 136,015,910.26 | 42,539,124.5668 | 178,555,034.8268 | 93,476,785.6932 |
| January–July 2026 | 169,276,486.5363+24.5% | 52,864,892.8555+24.3% | 222,141,379.3918+24.4% | 116,411,593.6808+22,934,807.99 USD |
Source: Information and Communication Technology Center with cooperation of the Customs Department (MOC Thailand Trade Report). TRCC statistics for this selection.
Merchandise trade only. Exports include re-exports. Prepared values stay fixed; provisional source data may later be revised.
Method and data notes
Exports include re-exports. Prepared values stay fixed; provisional source data may later be revised.
Changes compare consecutive calendar years or the same YTD cutoff. Balance changes are absolute currency amounts. No comparison is shown without a selected comparable baseline.
What is traded?
The leading export chapters for January–July 2026 show substantial existing flows in electrical equipment and machinery. Electrical and electronic equipment accounted for USD 112.73 million, or 66.6%, of Thailand’s exports to Slovakia. Machinery and mechanical equipment followed at USD 18.63 million, or 11.0%, and optical and medical instruments at USD 13.41 million, or 7.9%.The leading import chapters for the same period were more distributed. Machinery and mechanical equipment accounted for USD 10.31 million, or 19.5%; electrical and electronic equipment for USD 9.51 million, or 18.0%; and motor vehicles and parts for USD 9.10 million, or 17.2%. Arms and ammunition were also a substantial recorded import chapter, at USD 8.93 million, or 16.9%. Its inclusion reflects the published ranking, not the forum’s programme or an endorsement of a particular activity.
Leading HS 2022 product groups, January–July 2026
January–July 2026 · USD · Thailand reporting
Thailand exports to SLOVAKIA
Thailand exports · HS 2022 · January–July 2026 · USD · Calculated by TRCC
Select a chapter to see its top HS4 products.
MOC total and TRCC sum agree — show both figures
- MOC control total
- US$169,276,486.54MOC SummaryCountries
- TRCC sum of all HS2 groups
- US$169,276,486.54All MOC HS2 chapters available for this period and direction
The two values agree within the accepted MOC report precision.
- Electrical and electronic equipmentHS 85 · Two-digit commodity code US$112.7M66.6% of all HS2 chapters
- Machinery and mechanical equipmentHS 84 · Two-digit commodity code US$18.6M11.0% of all HS2 chapters
- Optical and medical instrumentsHS 90 · Two-digit commodity code US$13.4M7.9% of all HS2 chapters
- Rubber and rubber articlesHS 40 · Two-digit commodity code US$7.3M4.3% of all HS2 chapters
- Prepared meat, seafood and insectsHS 16 · Two-digit commodity code US$4.2M2.5% of all HS2 chapters
Thailand exports to SLOVAKIA — exact values and shares · USD
| HS | Product group | USD | Share of all HS2 chapters |
|---|---|---|---|
| 85 | Electrical and electronic equipmentElectrical machinery and equipment, sound and television recording and reproducing apparatus, and their parts and accessories. | 112,726,617.4197 | 66.6% |
| 84 | Machinery and mechanical equipmentNuclear reactors, boilers, machinery and mechanical appliances, and their parts. | 18,625,450.1005 | 11.0% |
| 90 | Optical and medical instrumentsOptical, photographic, cinematographic, measuring, checking, precision, medical and surgical instruments and apparatus, and their parts. | 13,413,686.9615 | 7.9% |
| 40 | Rubber and rubber articlesNatural and synthetic rubber, and rubber articles such as tyres, tubes and other rubber goods. | 7,304,441.9498 | 4.3% |
| 16 | Prepared meat, seafood and insectsPrepared or preserved meat, fish, crustaceans, molluscs, other aquatic invertebrates, or insects. | 4,215,785.9519 | 2.5% |
Thailand imports from SLOVAKIA
Thailand imports · HS 2022 · January–July 2026 · USD · Calculated by TRCC
Select a chapter to see its top HS4 products.
MOC total and TRCC sum agree — show both figures
- MOC control total
- US$52,864,892.86MOC SummaryCountries
- TRCC sum of all HS2 groups
- US$52,864,892.86All MOC HS2 chapters available for this period and direction
The two values agree within the accepted MOC report precision.
- Machinery and mechanical equipmentHS 84 · Two-digit commodity code US$10.3M19.5% of all HS2 chapters
- Electrical and electronic equipmentHS 85 · Two-digit commodity code US$9.5M18.0% of all HS2 chapters
- Motor vehicles and partsHS 87 · Two-digit commodity code US$9.1M17.2% of all HS2 chapters
- Arms and ammunitionHS 93 · Two-digit commodity code US$8.9M16.9% of all HS2 chapters
- Soap, detergents, lubricants and waxesHS 34 · Two-digit commodity code US$2.8M5.3% of all HS2 chapters
Thailand imports from SLOVAKIA — exact values and shares · USD
| HS | Product group | USD | Share of all HS2 chapters |
|---|---|---|---|
| 84 | Machinery and mechanical equipmentNuclear reactors, boilers, machinery and mechanical appliances, and their parts. | 10,314,225.1165 | 19.5% |
| 85 | Electrical and electronic equipmentElectrical machinery and equipment, sound and television recording and reproducing apparatus, and their parts and accessories. | 9,507,285.5822 | 18.0% |
| 87 | Motor vehicles and partsMotor vehicles and other vehicles other than railway or tramway rolling stock, and their parts and accessories. | 9,103,639.2263 | 17.2% |
| 93 | Arms and ammunitionArms and ammunition, and their parts and accessories. | 8,929,014.4554 | 16.9% |
| 34 | Soap, detergents, lubricants and waxesSoap, surface-active agents, washing and lubricating preparations, waxes, polishes, candles and dental preparations. | 2,783,706.7606 | 5.3% |
Source: Information and Communication Technology Center with cooperation of the Customs Department (MOC Thailand Trade Report). TRCC statistics for this selection.
Merchandise trade only. Exports include re-exports. Prepared values stay fixed; provisional source data may later be revised. HS 2022. Shares use all HS2 chapters for the same direction, period and currency, not the top-five subtotal.
Method and data notes
Exports include re-exports. Prepared values stay fixed; provisional source data may later be revised.
HS 2022. Shares use all HS2 chapters for the same direction, period and currency, not the top-five subtotal.
Questions for business conversations
For companies working in machinery, industrial automation and electrical technologies, the figures suggest practical questions to take into a first meeting—not evidence of demand for a particular new product or a guaranteed partnership.Which specific products and HS codes match the proposed cooperation, and what specifications, certifications and customer requirements must they meet?
What order volumes, delivery times and payment terms can each side support, and who will provide installation, after-sales service and spare parts?
What evidence of customer demand and what trial order or pilot would be needed before either side commits to a longer-term supply or investment relationship?
The concentration of Thailand’s exports in electrical equipment is another reason to examine product detail before drawing conclusions from the overall growth rate. Opportunities discussed in AI, cybersecurity, finance or education cannot be assessed from merchandise statistics alone: these figures do not measure trade in services.
For registration and current practical information, visit the Thai–Slovak Business Forum event page.
Data note: Source — Information and Communication Technology Center with cooperation of the Customs Department, through the MOC Thailand Trade Report and TRCC Trade Statistics. January–July 2026 is the latest reliable common country/product period verified for this article. Product shares use the TRCC sum of all HS2 chapters in the corresponding direction, period and currency, not the top-five subtotal; MOC control totals agree for this selection. Product labels follow TRCC’s HS 2022 registry. Narrative amounts are rounded to millions and percentages to one decimal; tables retain the full precision stored in the published sources. Exports include re-exports; provisional 2026 figures may be revised. Rounding individual amounts independently may produce a one-cent difference when adding figures displayed elsewhere to two decimal places; the underlying reported totals are preserved. Comparable July 2025 product data are not published in this lineage, so no product-level year-on-year change is claimed. No cross-HS-revision product trend is inferred.
Event details, registration and documents
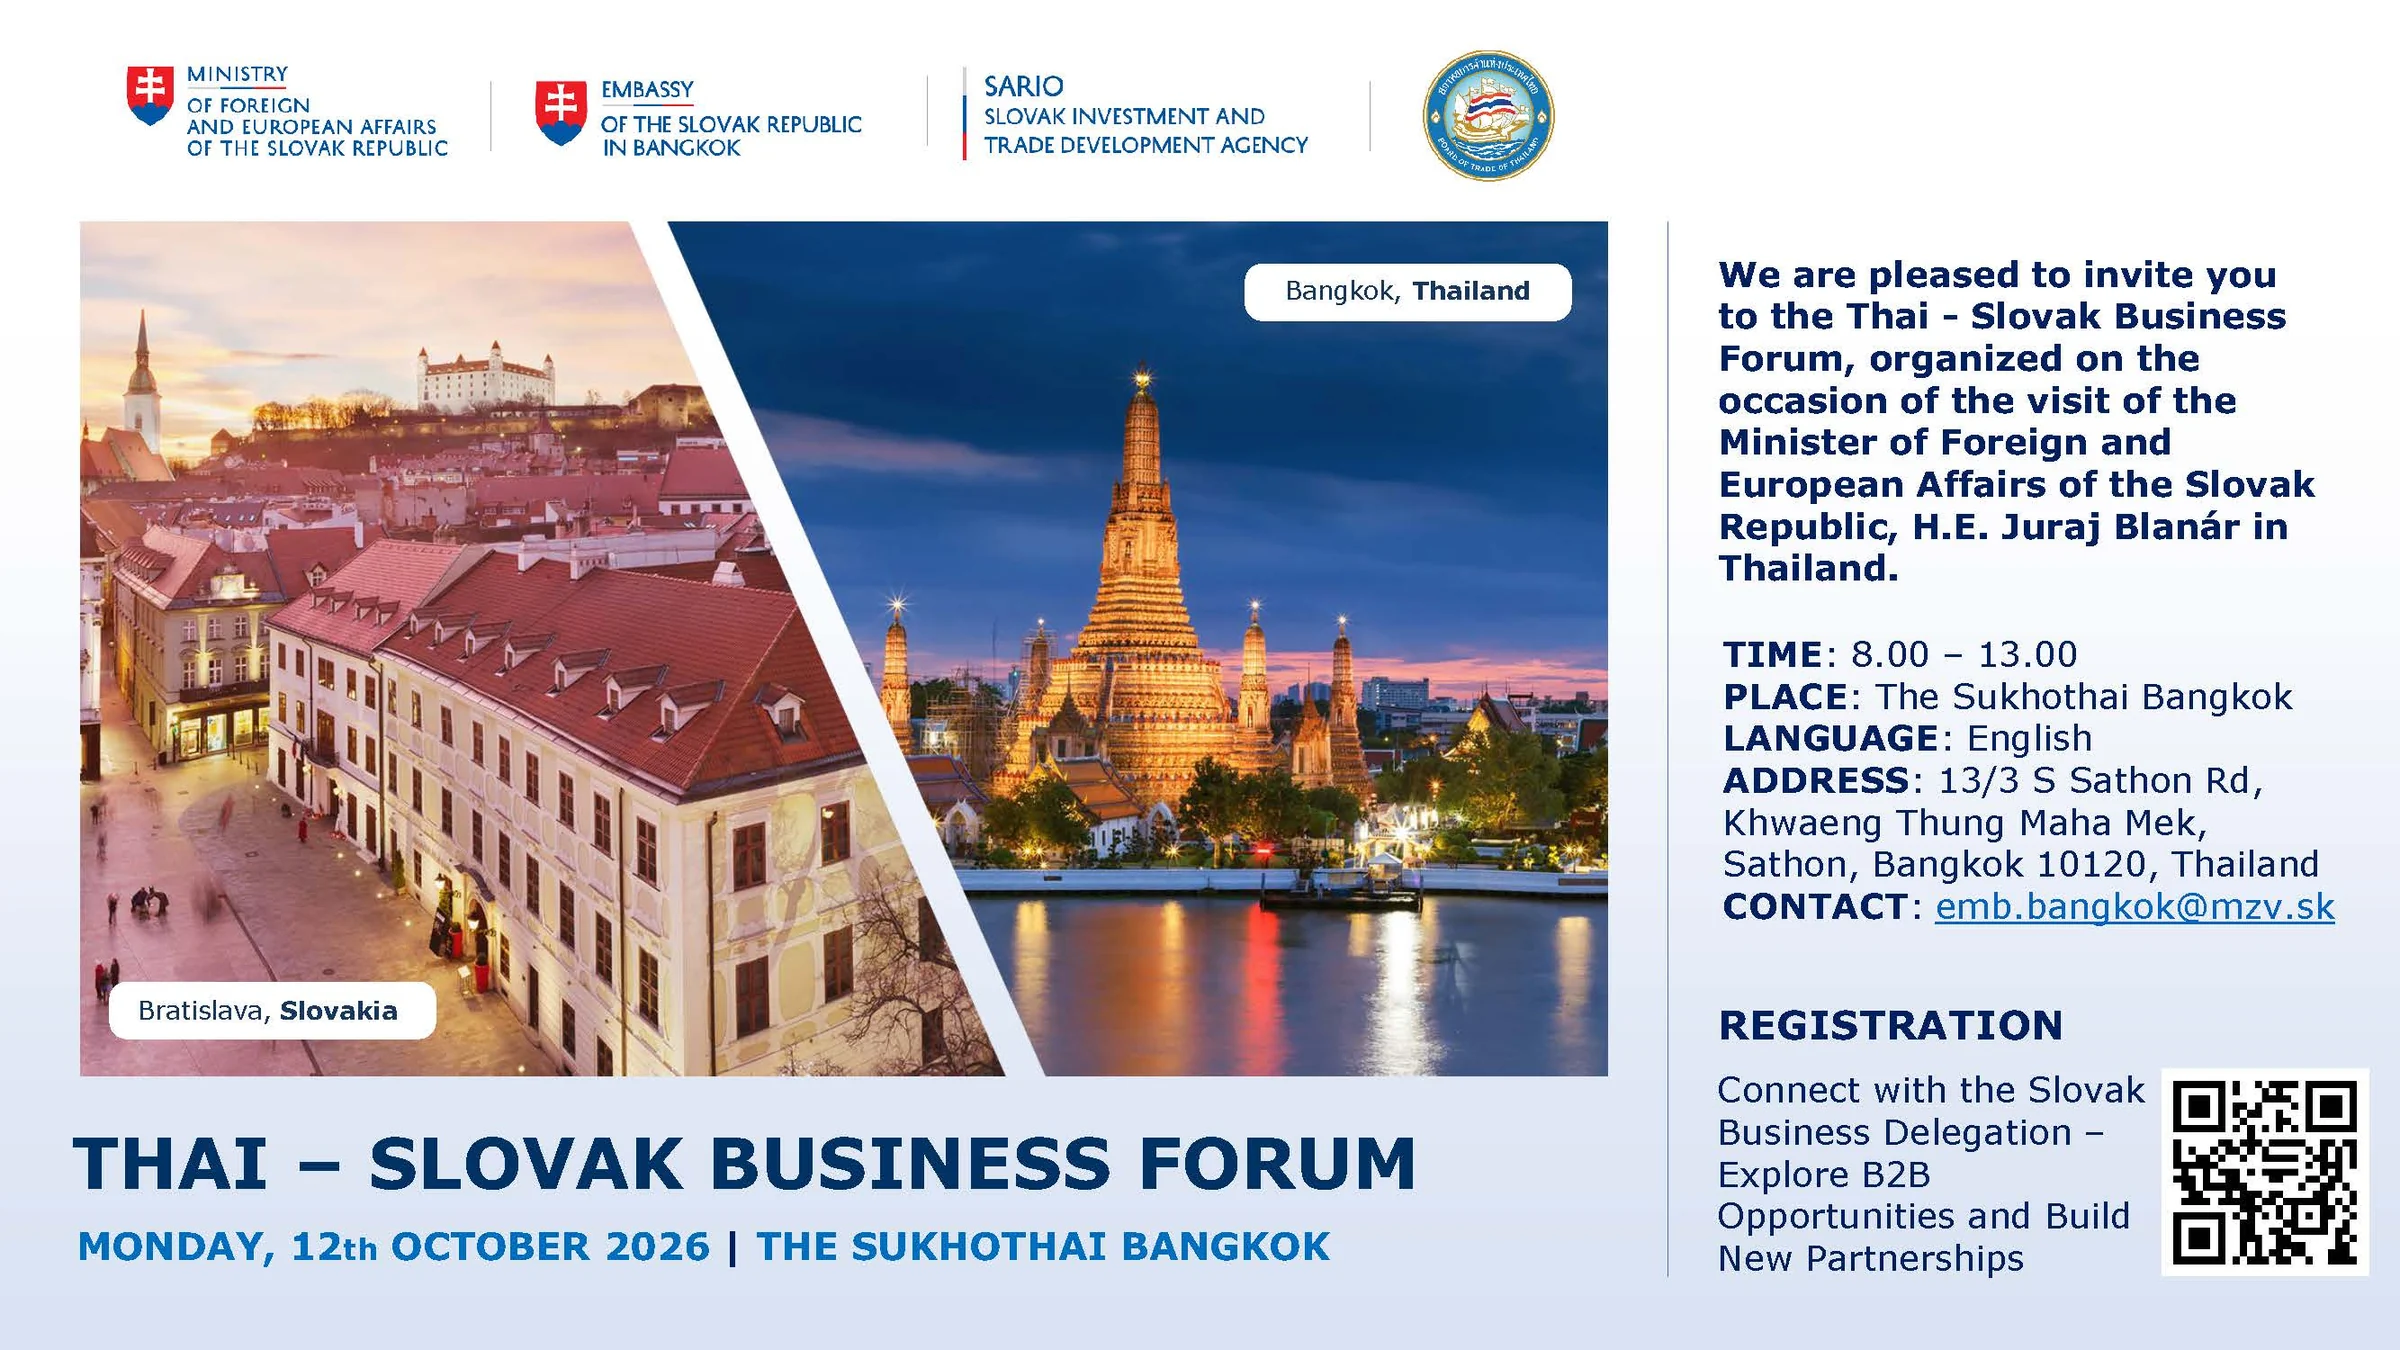
Partner Event Embassy of the Slovak Republic in Bangkok
Thai-Slovak Business Forum 2026
Meet Slovak businesses and explore trade, investment and B2B partnerships on 12 October 2026 at The Sukhothai Bangkok.
View event