
TRCC News
Russian arrivals rise 5% as Thailand’s total falls — July–September 2026
Russian arrivals were higher year on year in each month of July–September 2026, while Thailand’s official international total declined in all three. TRCC applies JFCCT’s emphasis on tourism value to provisional MoTS figures.
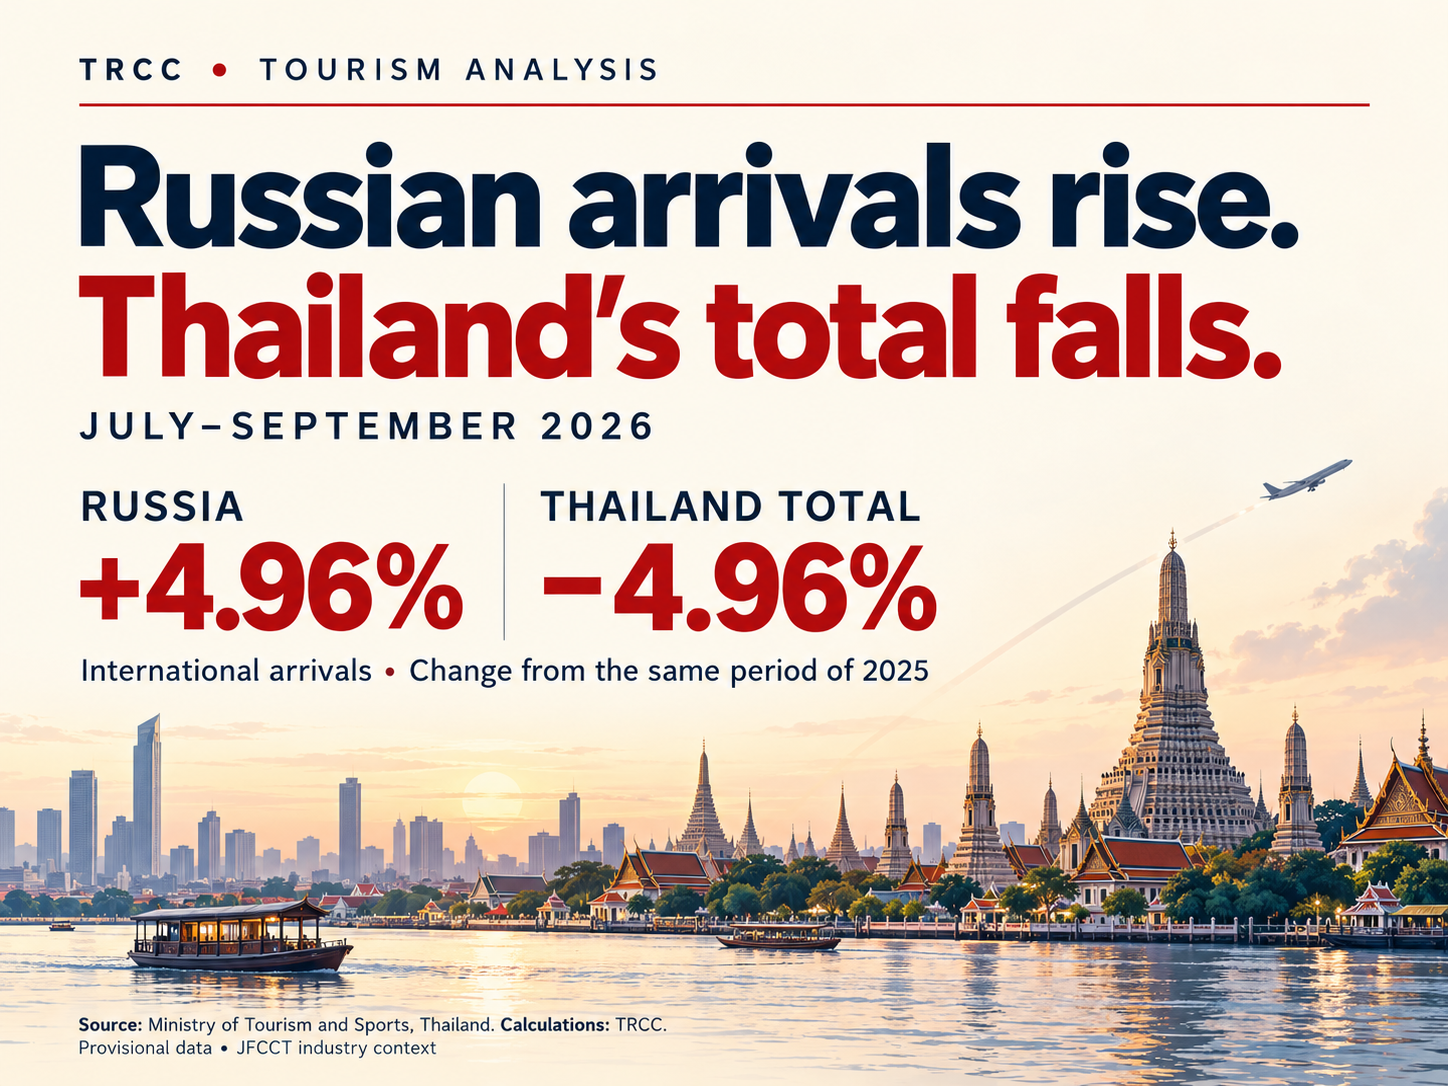
TRCC’s calculation from Ministry of Tourism and Sports (MoTS) monthly figures shows 11,788 more Russian arrivals in July–September, bringing the total to 249,366. Thailand’s official international total fell by 368,585 to 7,061,274. These are changes of +4.96% and −4.96%, respectively, compared with the same months of 2025; their matching size is a rounding coincidence.
In each month from February through May, the year-on-year percentage change in Russian arrivals was lower than the percentage change in Thailand’s total. In each month of July–September it was higher. The January–May totals — Russia down 1.50%, against a 2.30% decline overall — conceal that monthly variation. Each available month is compared with the same month of 2025; June remains a gap, so no January–September total or year-to-date recovery is claimed.
Russian and total arrivals: monthly growth, Jan–Sep 2026
January–September 2026 compared with the same months of 2025 · arrival events · Provisional
Total for January–September 2026 is unavailable because the period contains gaps. No shorter subtotal is shown.
Russian Federation
Thailand total
Year-on-year change, % · same month of the previous year · common scale
Monthly year-on-year change
Gaps are unavailable, never zero. June · Russian Federation: June completeness is unverified. June · Thailand · all international arrivals: June completeness is unverified.
Exact arrivals and year-on-year changes
Scroll the exact table horizontally to compare both years and changes.
| Period / market | 2026 | 2025 | Change |
|---|---|---|---|
| Jan · Russian Federation | 272,959 | 255,920 | +17,039+6.66%Provisional / Provisional |
| Feb · Russian Federation | 231,797 | 230,600 | +1,197+0.52%Provisional / Provisional |
| Mar · Russian Federation | 221,202 | 235,682 | -14,480-6.14%Provisional / Provisional |
| Apr · Russian Federation | 137,592 | 155,314 | -17,722-11.41%Provisional / Provisional |
| May · Russian Federation | 83,182 | 83,627 | -445-0.53%Provisional / Provisional |
| Jun · Russian Federation | Unavailable | Unavailable | UnavailableUnavailableUnavailable / UnavailableJune completeness is unverified. |
| Jul · Russian Federation | 86,768 | 81,098 | +5,670+6.99%Provisional / Provisional |
| Aug · Russian Federation | 80,854 | 79,573 | +1,281+1.61%Provisional / Provisional |
| Sep · Russian Federation | 81,744 | 76,907 | +4,837+6.29%Provisional / Provisional |
| Jan · Thailand total | 3,277,908 | 3,709,102 | -431,194-11.63%Provisional / Provisional |
| Feb · Thailand total | 3,263,802 | 3,119,445 | +144,357+4.63%Provisional / Provisional |
| Mar · Thailand total | 2,775,199 | 2,720,457 | +54,742+2.01%Provisional / Provisional |
| Apr · Thailand total | 2,368,895 | 2,547,116 | -178,221-7.00%Provisional / Provisional |
| May · Thailand total | 2,346,845 | 2,266,574 | +80,271+3.54%Provisional / Provisional |
| Jun · Thailand total | Unavailable | Unavailable | UnavailableUnavailableUnavailable / UnavailableJune completeness is unverified. |
| Jul · Thailand total | 2,545,616 | 2,610,369 | -64,753-2.48%Provisional / Provisional |
| Aug · Thailand total | 2,515,319 | 2,583,638 | -68,319-2.64%Provisional / Provisional |
| Sep · Thailand total | 2,000,339 | 2,235,852 | -235,513-10.53%Provisional / Provisional |
Source: Ministry of Tourism and Sports, Thailand. Calculations: TRCC. Explore Tourism Statistics. 2026-10-01 release (XLSX).
Nationality-based international tourist arrival events, not unique people or spending. Source preliminary/revised status is retained in the exact table. This insert retains its prepared values; later releases may revise them.
Method and limitations
Changes compare the same complete months and release. Seasonal context outside the selected comparison can use another attributed release; it is not included in comparisons or totals. Its current-year cells remain blank. No previous release fills a disputed or missing comparison. Window totals and percentages require every month in both years; a gap leaves the monthly history visible but withholds the whole-window total. Window percentages use sums, not an average of monthly rates. Missing or disputed periods are never zero. A zero prior value has no percentage change. Thailand total is the official international total, not world tourism or a sum of selected markets. Provincial visits and airport arrivals are separate measures.
Russia gains ground within a smaller market
The year-on-year increase was uneven: 6.99% in July, 1.61% in August and 6.29% in September. Arrivals did not rise continuously month to month: they fell from 86,768 in July to 80,854 in August, then recovered slightly to 81,744 in September.September sharpened the contrast. Thailand recorded 2,000,339 international arrivals, down 10.53% year on year. Russian arrivals reached 81,744, up 6.29%, making Russia the fifth-largest of the 91 individually reported source markets for that month.
Russia’s share of September arrivals rose from 3.44% to 4.09%, an increase of 0.65 percentage points. Both sides of that calculation matter: Russian arrivals increased, while the national total decreased. A larger share does not, by itself, demonstrate a comparable increase in spending or hotel revenue.
The gains were also too small to reverse the broader decline. Russia added 4,837 arrivals in September. Malaysia lost 167,387, while India lost 40,346. China added 27,873 and Japan 4,850. These movements show why a national average can be a poor guide to an individual operator’s customer base.
What arrival figures cannot show
The JFCCT report puts travel costs, accommodation regulation and regional competitiveness on the industry’s agenda. Its central measurement argument is that fuller aircraft and hotels need to translate into stronger economic returns.One immediate policy question is the proposed departure tax. The Revenue Department’s consultation documents envisage a THB 1,000 charge on departures by air, applying across nationalities with exemptions. Consultation is scheduled to close on 29 October. The proposal remains under consultation; it should not be described as an existing charge.
JFCCT’s concern is the cumulative cost of visiting Thailand. The arrivals series cannot establish how the proposed tax would affect Russian demand, and September’s figures do not measure its impact. For businesses, the useful response is to assess the complete trip price alongside bookings, cancellations, length of stay and customer spending.
Revenue adds a broader context
MoTS’s provincial statistics provide revenue context without a breakdown by individual nationality. For January–August 2026, reported visitor revenue across all provinces rose 1.08% from the same eight months of 2025, to THB 1.921 trillion. An increase of THB 25.98 billion in the source’s Thai category more than offset a THB 5.38 billion decline in its Foreign category, where revenue fell 0.48%.These figures stop in August, rather than September, and describe provincial visitor revenue, not border arrivals. Thai and Foreign are the source’s categories; they do not identify Russian spending. Applying Russia’s share of national arrivals to these revenues would not provide a valid estimate, and the figures do not establish hotel profitability or spending per visitor.
What the figures mean for operators
The Russian result supports closer attention to that customer segment. An operator serving Russian guests should examine its own forward bookings and revenue per stay before making capacity or marketing decisions based on Thailand’s declining aggregate. Higher year-on-year arrivals in three months are not evidence that Russian visitors are spending more.A separate source shows that the national increase was not visible at Phuket Airport. The Phuket Airport Immigration Checkpoint, which publishes passenger arrivals on international flights by nationality, recorded 131,883 Russian arrivals in July–September 2026, 989 or 0.74% fewer than a year earlier: up 1.92% in July, down 3.45% in August and down 0.59% in September. Russians were nevertheless the largest nationality at the checkpoint in September, with 42,803 arrivals or 14.27% of its total. These are passenger arrivals at one airport, not the MoTS national series, so the two cannot be subtracted or expressed as a share of each other. The practical point is that Thailand-wide Russian growth does not automatically reach every destination: Phuket businesses in particular should not read the national increase as their own.
Seasonality also limits the inference. Russian arrivals were 80,854–86,768 a month in July–September 2026, compared with 272,959 in January. The available calendar-year 2025 context shows the same broad seasonal pattern, with 145,764 arrivals in October, 214,523 in November and 266,213 in December; June is excluded because its completeness remains unverified. Growth in the lower-volume July–September period does not, by itself, predict the coming high season.
Russian and total arrivals: 2025–2026 seasonal context
2025 January–December context · selected current months: January–September 2026 · arrival events · Provisional
2026
2025
Monthly arrival events · separate scales for country and Thailand total
Prior-year months after the selected cutoff are context only; they are not compared or aggregated across releases.
Russian Federation
Thailand · all international arrivals
Gaps are unavailable, never zero. June · Russian Federation: June completeness is unverified. June · Thailand total: June completeness is unverified.
Exact arrivals and year-on-year changes
Scroll the exact table horizontally to compare both years and changes.
| Period / market | 2026 | 2025 | Change |
|---|---|---|---|
| Jan · Russian Federation | 272,959 | 255,920 | +17,039+6.66%Provisional / Provisional |
| Feb · Russian Federation | 231,797 | 230,600 | +1,197+0.52%Provisional / Provisional |
| Mar · Russian Federation | 221,202 | 235,682 | -14,480-6.14%Provisional / Provisional |
| Apr · Russian Federation | 137,592 | 155,314 | -17,722-11.41%Provisional / Provisional |
| May · Russian Federation | 83,182 | 83,627 | -445-0.53%Provisional / Provisional |
| Jun · Russian Federation | Unavailable | Unavailable | UnavailableUnavailableUnavailable / UnavailableJune completeness is unverified. |
| Jul · Russian Federation | 86,768 | 81,098 | +5,670+6.99%Provisional / Provisional |
| Aug · Russian Federation | 80,854 | 79,573 | +1,281+1.61%Provisional / Provisional |
| Sep · Russian Federation | 81,744 | 76,907 | +4,837+6.29%Provisional / Provisional |
| Oct · Russian Federation | Unavailable | 145,764 | UnavailableUnavailableunavailable / ProvisionalPrior-year months after the selected cutoff are context only; they are not compared or aggregated across releases. |
| Nov · Russian Federation | Unavailable | 214,523 | UnavailableUnavailableunavailable / ProvisionalPrior-year months after the selected cutoff are context only; they are not compared or aggregated across releases. |
| Dec · Russian Federation | Unavailable | 266,213 | UnavailableUnavailableunavailable / ProvisionalPrior-year months after the selected cutoff are context only; they are not compared or aggregated across releases. |
| Jan · Thailand total | 3,277,908 | 3,709,102 | -431,194-11.63%Provisional / Provisional |
| Feb · Thailand total | 3,263,802 | 3,119,445 | +144,357+4.63%Provisional / Provisional |
| Mar · Thailand total | 2,775,199 | 2,720,457 | +54,742+2.01%Provisional / Provisional |
| Apr · Thailand total | 2,368,895 | 2,547,116 | -178,221-7.00%Provisional / Provisional |
| May · Thailand total | 2,346,845 | 2,266,574 | +80,271+3.54%Provisional / Provisional |
| Jun · Thailand total | Unavailable | Unavailable | UnavailableUnavailableUnavailable / UnavailableJune completeness is unverified. |
| Jul · Thailand total | 2,545,616 | 2,610,369 | -64,753-2.48%Provisional / Provisional |
| Aug · Thailand total | 2,515,319 | 2,583,638 | -68,319-2.64%Provisional / Provisional |
| Sep · Thailand total | 2,000,339 | 2,235,852 | -235,513-10.53%Provisional / Provisional |
| Oct · Thailand total | Unavailable | 2,573,743 | UnavailableUnavailableunavailable / ProvisionalPrior-year months after the selected cutoff are context only; they are not compared or aggregated across releases. |
| Nov · Thailand total | Unavailable | 2,914,810 | UnavailableUnavailableunavailable / ProvisionalPrior-year months after the selected cutoff are context only; they are not compared or aggregated across releases. |
| Dec · Thailand total | Unavailable | 3,370,440 | UnavailableUnavailableunavailable / ProvisionalPrior-year months after the selected cutoff are context only; they are not compared or aggregated across releases. |
Source: Ministry of Tourism and Sports, Thailand. Calculations: TRCC. Explore Tourism Statistics. 2026-10-01 release (XLSX); 2025 release (XLSX).
Nationality-based international tourist arrival events, not unique people or spending. Source preliminary/revised status is retained in the exact table. This insert retains its prepared values; later releases may revise them.
Method and limitations
Changes compare the same complete months and release. Seasonal context outside the selected comparison can use another attributed release; it is not included in comparisons or totals. Its current-year cells remain blank. No previous release fills a disputed or missing comparison. Window totals and percentages require every month in both years; a gap leaves the monthly history visible but withholds the whole-window total. Window percentages use sums, not an average of monthly rates. Missing or disputed periods are never zero. A zero prior value has no percentage change. Thailand total is the official international total, not world tourism or a sum of selected markets. Provincial visits and airport arrivals are separate measures.
Related event: II Russian–Thai Investment Forum 2026.
Кратко по-русски
В июле–сентябре 2026 года число прибытий из России в Таиланд выросло на 4,96%, до 249 366, тогда как общий международный поток сократился на 4,96%, до 7,06 млн. В феврале–мае годовая динамика России каждый месяц была слабее общего показателя Таиланда, а в июле–сентябре — выше него. В каждом из трёх последних месяцев показатель был выше, чем годом ранее, но не рос непрерывно месяц к месяцу: в августе прибытия снизились относительно июля. Годовой прирост в августе составил лишь 1,61%. Календарный контекст 2025 года показывает сезонность: после 145 764 прибытий в октябре их число выросло до 214 523 в ноябре и 266 213 в декабре; июнь исключён из-за непроверенной полноты. Отдельный источник — иммиграционный пункт аэропорта Пхукета — зафиксировал в июле–сентябре 131 883 прибытия россиян международными рейсами, на 0,74% меньше, чем годом ранее, хотя в сентябре россияне оставались там крупнейшей национальностью (14,27% прибытий). Национальный рост не обязательно доходит до каждого направления. Это основание внимательнее работать с российским сегментом, но не доказательство роста расходов туристов, результата высокого сезона или восстановления за весь год. В отдельной провинциальной статистике MoTS за январь–август общие доходы выросли на 1,08%: прирост категории Thai перекрыл снижение доходов категории Foreign на 0,48%. Эти данные не показывают расходы россиян. JFCCT предлагает оценивать экономическую отдачу туризма вместе с числом прибытий; вывод TRCC — сопоставлять динамику каждого рынка с бронированиями, длительностью пребывания и выручкой своего бизнеса.Sources and methodology
Industry context: Weekly Tourism Report, 19 October 2026, by Andrew J. Wood, Chair, Tourism Committee, Joint Foreign Chambers of Commerce in Thailand (JFCCT). Report supplied to TRCC. The report’s commentary is attributed to JFCCT; the statistical calculations and interpretation in this article are TRCC’s. JFCCT organisation website: https://www.jfcct.org/Source: Ministry of Tourism and Sports, Thailand. Calculations: TRCC. Provisional nationality-based arrival events, not unique people. All arrival comparisons use the same months and the same retained MoTS release of 1 October 2026. The seasonal context uses that latest release for January–September 2025 and the retained 2025 annual release for October–December. July–September totals are sums of three complete months, not official quarterly releases or year-to-date totals. June is excluded from use; no value has been replaced with zero. The Thailand benchmark is the official international total, not a sum of selected markets. Changes in share are percentage points. Figures may be revised.
Official MoTS XLSX
Official 2025 MoTS XLSX
Provincial revenue context: the official all-provinces row in the MoTS release of 14 September 2026, January–August 2026 versus January–August 2025. Source unit: million THB; trillion/billion-THB values above are display conversions. TRCC checked the sum of the eight monthly values against the source’s cumulative sheet and the Thai/Foreign components against the total. The cumulative source marks 2026 provisional and 2025 revised; September is not available in this release. The provincial series is separate from the nationality-based arrival series. Revenue estimation and price basis are not verified; no inflation-adjusted growth, profit or spending-per-person measure is inferred.
Official provincial MoTS XLSX: https://www.mots.go.th/images/v2022_84449624-a42a-4e8b-8c2f-eb983373f91b.xlsx
TRCC Tourism Statistics — September 2026
Russia in TRCC Tourism Statistics — September 2026
Phuket Airport context: passenger arrivals on international flights by nationality, published by the Phuket Airport Immigration Checkpoint in the Phuket provincial data catalogue (2025 file; 2026 file retrieved 7 October 2026, replaced in place by the publisher, with no revision status stated). July–September totals and changes are TRCC calculations from the same monthly rows. This is a separate measure from the MoTS national arrival series. Russia at Phuket Airport in TRCC Tourism Statistics: https://trcc.or.th/resources/tourism-statistics/provinces/?scope=MOTS:PROVINCE:PHUKET&airport_market=L4db4a5e9bf1c94ae&airport_period=2026-09
Revenue Department consultation: https://www.rd.go.th/68716.html
Official draft principles: https://www.rd.go.th/fileadmin/user_upload/kormor/newlaw/Public_Consultation_on_Principles_of_Departure_Tax.pdf
Event details, registration and documents

Partner Event Russian-Thai Business Council (RTBC)
From to — Time TBA
II Russian–Thai Investment Forum 2026
Event time is not yet confirmed
The II Russian–Thai Investment Forum brings companies, institutions and business associations from Russia and Thailand together in Bangkok for three days of investment dialogue, …
View event